會有這一篇的介紹文, 完全是因為做了口罩地圖的sideProject, 雖然說還有很多可以再增加的功能, 但是可以做到這樣的程度, 筆者我已經很滿意了. 畢竟碰Vue的時間不長, 也沒有引入其他外部JS的相關經驗. 真的要感謝六角的拋磚引玉和教學, 讓自己也能夠對社會做出一點貢獻.
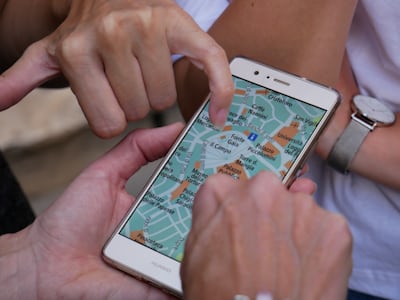
筆者製作的口罩地圖
(本篇介紹是用OpenStreetMap和Leaflet.js來說明)
預先知識
地圖概念
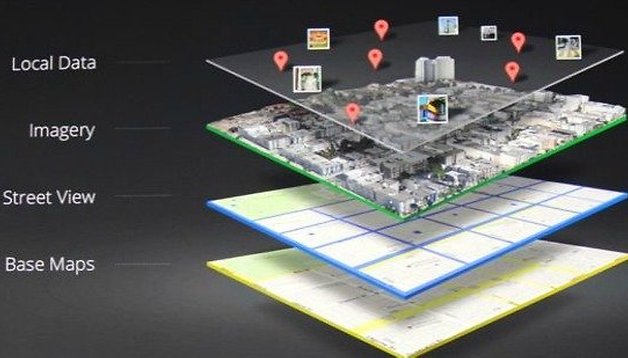
這是圖層的概念, 就像調酒一樣, 一開始有基酒, 在往上加上上加上香甜酒, 水果等增加風味
Leaflet
Leaflet是一個開源的JavaScript資源庫,適合移動裝置的互動地圖開發使用
操作步驟如下:
- 在網頁中加入CSS連結
- 在上面的CSS連結之後加上JavaScript連結(一定要在CSS之後!!!)
- 給地圖一個空間, 在body中給一個空間放地圖, 命名id為map
- 將網頁的高填滿(可以在CSS下height: 100vh) 撐高
- codepen支援
起手式
如何載入地圖?
想像在網頁中要建立一個地圖,首先會需要放地圖的容器(空間),然後在容器中加入底圖、圖層以及想要的物件等。
1
2
3
4
5
6
7
8
9
10
11
| var map = L.map('map', {
center: [22.604799,120.2976256],
zoom: 16
});
L.tileLayer('https://{s}.tile.openstreetmap.org/{z}/{x}/{y}.png', {
attribution: '© <a href="https://www.openstreetmap.org/copyright">OpenStreetMap</a> contributors'
}).addTo(map);
|
如何在地圖上放上標示點?
筆者這邊用到的, 是引入這個開源專案裡面的icon. 可以看到在readme裡面有把語法標示出來
1
| L.marker([51.5, -0.09], {icon: greenIcon}).addTo(map);
|
效能處理
當maker一多的時候, 整個圖片的拖曳就會變得很緩慢, 因此載入Leaflet.markercluster, 這一套開源軟體. 好處是會把附近的點都聚集起來, 當放大地圖的時候, maker會發散出去, 不僅美觀, 也很易懂
範例如下圖:

1
2
3
4
5
6
7
8
9
10
|
var markers = new L.MarkerClusterGroup().addTo(map);;
for(let i =0;data.length>i;i++){
console.log(data[i].name)
markers.addLayer(L.marker([data[i].lat,data[i].lng], {icon: greenIcon}));
}
map.addLayer(markers);
|
注意事項: 直接放上去是不夠的, 還需要放入css, 否則集合體只是數字而已, 另外也可以特別針對某個集合體加上icon.
css參考連結
Vue中如何實作?
筆者上網也找了很多方法, 最後在StackOverflow看到比較好的作法.
我的作法是把每一家店都想成一張卡片, 一個一個拆成獨立的元件, 因此點選卡片時會把專屬這加店的資訊從內層傳到外層. 自認為這樣的作法比較直觀, 但是不知道效能上是否會有什麼影響?
App.vue中的template
1
2
3
4
5
6
7
8
| <Card
:store="item"
v-for="(item, key) in filterData"
:key="key"
@switchcard="switchGeo"
@switchshare="dayBegin"
>
</Card>
|
Card.vue中的scripts
1
2
3
4
5
6
7
8
9
10
11
12
13
14
15
16
| export default {
name: 'Card',
props: ['store'],
methods:{
getHref(address){
return `https://www.google.com.tw/maps/place/${address}`
},
setFocus(){
this.$emit('switchcard', this.store)
},
clickHandler(){
this.$emit('switchshare', this.store)
}
}
}
|
App.vue中的scripts
1
2
3
4
5
6
7
8
9
10
11
12
13
14
15
16
17
18
19
20
21
22
23
24
25
26
27
28
29
30
31
32
33
34
35
36
37
38
39
40
41
42
43
44
45
46
47
48
49
50
51
52
53
54
55
56
57
58
59
60
61
62
63
64
65
66
67
68
69
70
71
72
73
| methods:{
initialMap() {
osmMap = L.map("map", {
center: [24.956111, 121.536500],
zoom: 18
});
L.tileLayer("https://{s}.tile.openstreetmap.org/{z}/{x}/{y}.png", {
maxZoom: 19,
attribution:
'© <a href="http://www.openstreetmap.org/copyright">OpenStreetMap</a> contributors'
})
.addTo(osmMap)
},
switchGeo(store) {
let newLat = store.geometry.coordinates[1];
let newLng = store.geometry.coordinates[0];
osmMap.flyTo(new L.LatLng(newLat, newLng));
L.marker([newLat, newLng]).addTo(osmMap)
.bindPopup(
`<h4>${store.properties.name}</h4>
<p>
成人口罩:<mark>${store.properties.mask_adult}</mark><br>
兒童口罩:${store.properties.mask_child}<br>
診所電話:
<a href="tel:+886-${store.properties.phone}">${store.properties.phone}</a>
</p>`
).openPopup();
},
dataCreated() {
this.status.fileUploading = true
this.isLoading = true
let markers = new L.MarkerClusterGroup().addTo(osmMap);
for (let i = 0; i < this.geoInfo.length; i++) {
this.status.fileUploading = false
this.isLoading = false
markers.addLayer(
L.marker([this.geoInfo[i].lng, this.geoInfo[i].lat], {
icon: this.filterColor(this.geoInfo[i].adult)
}).bindPopup(`<h3>${this.geoInfo[i].name}</h3>
<p>
成人口罩:${this.geoInfo[i].adult}
兒童口罩:${this.geoInfo[i].child}
診所電話:${this.geoInfo[i].phone}
</p>`)
);
}
osmMap.addLayer(markers);
},
}
mounted() {
this.initialMap()
this.dataCreated()
}
|
未增加到的功能:
- 地圖定位: 透過Browser API做到可以認出所在的位置, 但是只能用localhost來定位, 不能以開啟network連結定位的方法.
- 按下藥局旁的分享按鈕, 可以做出類似燈箱的效果, 並把營業時間(禮拜一到禮拜天) 依序轉換到table上. 目前筆者卡在依序轉換到table的column的實作上.
總結
這個真是一個很好的練習機會, 很開心自己能夠把握住, 雖然整體製作的時間蠻久的, 也有一些功能沒有實作出來, 但是過程中學到了不少東西. 總之看到實品是很開心的, 希望未來多多努力!
參考文獻